
Before you can detect value, you need to speak the same language as the market. Bookmakers communicate probability through odds — but odds come in three different formats depending on where you are in the world, and none of them state probability directly.
This lesson covers:
- Decimal, fractional, and American odds formats explained simply
- How to convert any odds format to implied probability
- What the vig is and why it matters for value detection
- How SupaBola's VIG calculator removes the bookmaker margin instantly
The Three Odds Formats
Decimal Odds (European)
The most intuitive format. The number represents your total return per unit staked — including your stake back.
Stake × Decimal Odds = Total Return
Examples:
- 2.00 odds on £10 stake → £20 return (£10 profit)
- 1.50 odds on £10 stake → £15 return (£5 profit)
- 4.00 odds on £10 stake → £40 return (£30 profit)
Decimal odds below 2.00 are "odds-on" (favourites). Above 2.00 are "odds-against" (underdogs). Even money is exactly 2.00.
Fractional Odds (UK/Ireland)
Traditional British format. The fraction represents profit relative to stake — the stake is not included in the return figure.
Odds 3/1: Win £3 for every £1 staked. Total return: £4. Odds 1/2: Win £1 for every £2 staked. Total return: £3.
To convert fractional to decimal: Decimal = (numerator / denominator) + 1
- 3/1 → (3/1) + 1 = 4.00
- 1/2 → (1/2) + 1 = 1.50
- 7/4 → (7/4) + 1 = 2.75
Fractional odds are falling out of favour as betting has become global. Most major bookmakers now show decimal by default.
American (Moneyline) Odds (US)
American odds use a +/− system anchored to a £100 stake. They are common on US-facing books and some international sportsbooks.
Positive (+) odds show profit on a £100 stake:
- +300 means win £300 on a £100 bet. Total return: £400. Equivalent to 4.00 decimal.
Negative (−) odds show how much you must stake to win £100:
- −150 means stake £150 to win £100. Total return: £250 on a £150 stake. Equivalent to 1.67 decimal.
To convert American to decimal:
- Positive: Decimal = (American / 100) + 1 → +300 = 4.00
- Negative: Decimal = (100 / |American|) + 1 → −150 = 1.667
For value betting purposes, always convert everything to decimal. It is the cleanest format for EV calculations.
Implied Probability: The Critical Conversion
Every set of odds implies a probability. This is the bookmaker's stated belief about how likely an outcome is.
Implied Probability = 1 / Decimal Odds
| Decimal Odds | Implied Probability | |---|---| | 1.25 | 80.0% | | 1.50 | 66.7% | | 2.00 | 50.0% | | 2.50 | 40.0% | | 3.00 | 33.3% | | 5.00 | 20.0% | | 10.00 | 10.0% |
Value exists when your estimated probability exceeds the implied probability. If you believe a team has a 45% chance of winning and the odds imply 35%, that gap is the edge.
The Vig: Why Implied Probabilities Add Up to More Than 100%
Here is the catch. In a three-way football market (Home / Draw / Away), a perfectly fair book would have the three implied probabilities add up to exactly 100%.
In reality, they add up to around 105-115%. The extra percentage is the bookmaker's vig (also called overround, juice, or margin). It is baked into every line, ensuring the bookmaker profits regardless of outcome.
Worked Example: Premier League Match
Chelsea vs West Ham. Bookmaker prices:
- Chelsea Win: 2.10 → implied 47.6%
- Draw: 3.30 → implied 30.3%
- West Ham Win: 3.80 → implied 26.3%
Total implied: 47.6% + 30.3% + 26.3% = 104.2%
The vig is 4.2%. This means even a randomly selected bet from this market loses 4.2% of stake on average. You need to identify the mispriced outcome — not just any outcome.
Why Vig Matters for Value Detection
If you compare your probability estimate to the raw implied probability from the odds, you are comparing against a slightly inflated number. A bookmaker-implied 47.6% for Chelsea might represent a true market estimate of ~45.7% once the vig is stripped out.
For precise value detection, you should remove the vig first, then compare your estimate to the cleaned probabilities.
The vig-adjusted probability formula for a 3-way market:
- Calculate raw implied probabilities for all three outcomes
- Sum them (e.g., 104.2%)
- Divide each raw probability by the sum to get the vig-adjusted probability
Chelsea adjusted: 47.6% / 104.2% = 45.7% Draw adjusted: 30.3% / 104.2% = 29.1% West Ham adjusted: 26.3% / 104.2% = 25.2% Total: 100%
Now compare your model to 45.7%, not 47.6%. If you estimate Chelsea at 55%, the adjusted gap is 9.3 points — a genuinely significant edge.
Using SupaBola's VIG Calculator
Doing this arithmetic manually is tedious and error-prone. SupaBola's VIG Calculator handles it automatically.
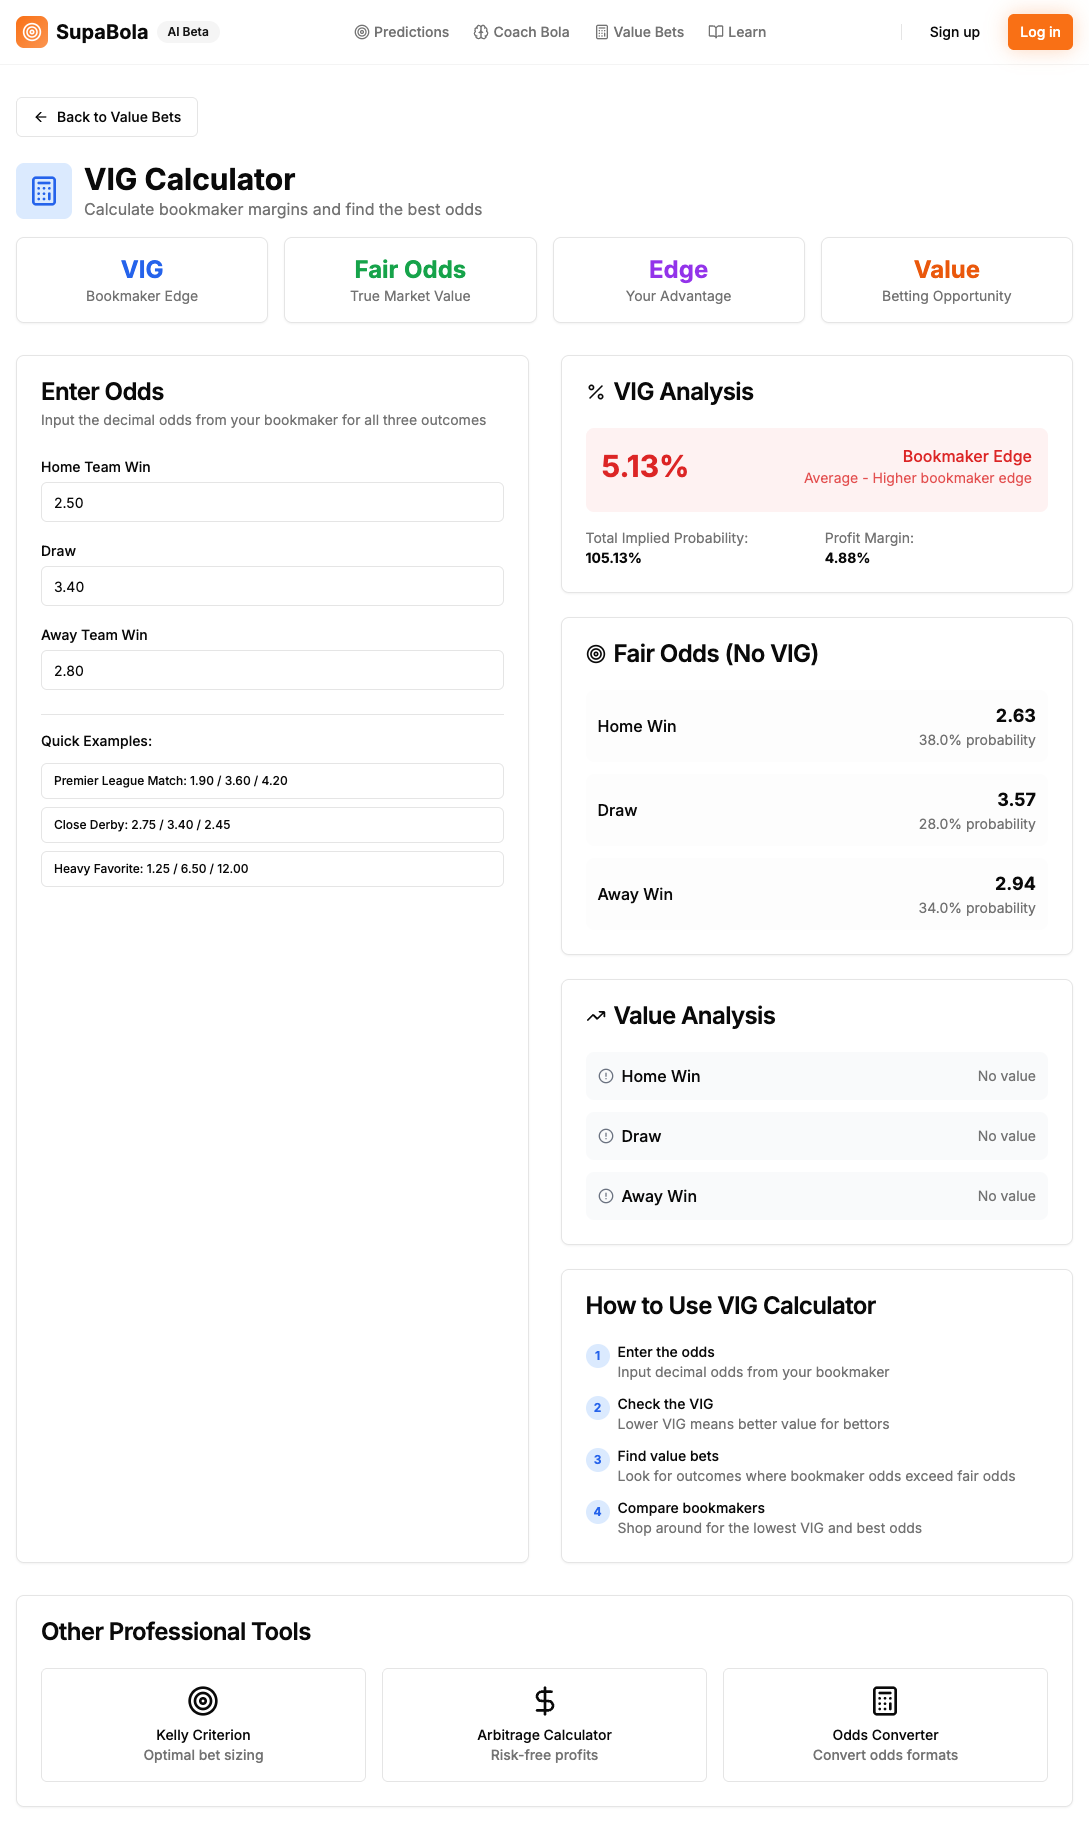
Enter the three odds for any match and the calculator instantly shows:
- The bookmaker's vig percentage
- The raw implied probabilities
- The vig-adjusted true probabilities for each outcome
- Which outcome has the lowest/highest margin built in
This is especially useful for comparing your probability model against the market. The adjustments change the comparisons meaningfully — particularly for markets with high vig (accumulators, certain Asian markets, halftime/fulltime).
Practical Example: Detecting Value with Adjusted Probabilities
Champions League group stage. Borussia Dortmund at home vs AC Milan.
Bookmaker odds:
- Dortmund Win: 1.75 → implied 57.1%
- Draw: 3.80 → implied 26.3%
- AC Milan Win: 4.60 → implied 21.7%
Total: 105.1% (vig: 5.1%)
Vig-adjusted probabilities:
- Dortmund Win: 57.1% / 105.1% = 54.3%
- Draw: 26.3% / 105.1% = 25.0%
- AC Milan Win: 21.7% / 105.1% = 20.6%
Your model, built on xG data, recent European form, and head-to-head history, estimates:
- Dortmund Win: 52%
- Draw: 28%
- AC Milan Win: 20%
No value on any outcome — your estimates are close to or below the vig-adjusted probabilities. You pass on this match.
The following week, a similar matchup appears — but Dortmund's first-choice keeper is doubtful and odds haven't adjusted yet. Your revised estimate puts Dortmund at 46%, but the market still prices them at 54.3% adjusted. Now the Draw at vig-adjusted 25% looks interesting if you estimate it at 30%. That is where you find value.
Converting Between All Three Formats Quickly
When you need to switch formats on the fly:
Decimal → Fractional: Subtract 1, then express as a fraction. 2.50 → 1.50 → 3/2 → commonly written as 3/2.
Decimal → American:
- If decimal ≥ 2.0: (Decimal − 1) × 100 → 3.50 → +250
- If decimal < 2.0: −100 / (Decimal − 1) → 1.40 → −250
Fractional → Decimal: (Numerator / Denominator) + 1 → 5/2 → 3.50
In practice, most platforms let you toggle the display format. What matters is building the habit of always thinking in probability.
Sharpening Your Probability Intuition
Professional bettors develop a fast intuition for odds-to-probability conversion. A few anchors worth memorising:
- Evens (2.0) = 50%
- 4/6 (1.67) = 60%
- 2/1 (3.0) = 33%
- 4/1 (5.0) = 20%
- 9/1 (10.0) = 10%
When you see odds in the wild, you should instinctively know the approximate implied probability before reaching for a calculator. It makes in-play scanning and quick comparisons significantly faster.
Key Takeaways
- Decimal odds represent total return per unit staked. Fractional shows profit only. American uses a ±100 anchor.
- Implied Probability = 1 / Decimal Odds. Always convert odds to probability before evaluating value.
- Bookmaker margins (vig) inflate raw implied probabilities to sum above 100%. Strip the vig before comparing your estimates.
- SupaBola's VIG Calculator removes the bookmaker margin instantly — enter any set of odds to see vig-adjusted probabilities.
- Value exists when your estimated probability exceeds the vig-adjusted implied probability by a meaningful margin (typically 3%+ to overcome variance).
For educational and informational purposes only. Not gambling advice. Please gamble responsibly.